How Microsoft Clarity helps you understand your users



Microsoft Clarity launched in 2020 to help site and app owners understand how users actually interact with their product. It uses heatmaps, session replays, an analytics dashboard, AI-generated insights, and integrations with other platforms to do that. We'll walk through each of these features below.
In short, Clarity turns raw user interactions into visuals you can act on, so you understand what's going on and what needs fixing. Clarity isn't unique in what it offers, and there are several competing platforms. Two things make it stand out: how easy it is to get started, and the fact that it's completely free with no usage caps.
Let's take a closer look at Clarity's key features, then see how Softr users can get the most out of it.
Heatmaps
Heatmaps show the actions users take on a given web page as an image you can read at a glance. Clarity’s heatmaps employ a color palette to show which areas of the page are more popular (warmer colors) and which ones are more or less neglected (cooler colors). In Clarity, you have 3 types of heatmaps:
- Click heatmaps: where users click (or tap if they’re on a mobile device) on the page
- Scroll heatmaps: how far users scroll on the page
- Area heatmaps: select a specific area on the page and see the total number of clicks
Heatmaps can be used by product teams, UX designers, marketers, and others to gain deep insights into user behavior and understand the causes behind the issues with product adoption, poor conversion (for example, why a certain call-to-action button doesn't work), UI problems on particular screen or device types, and so on.
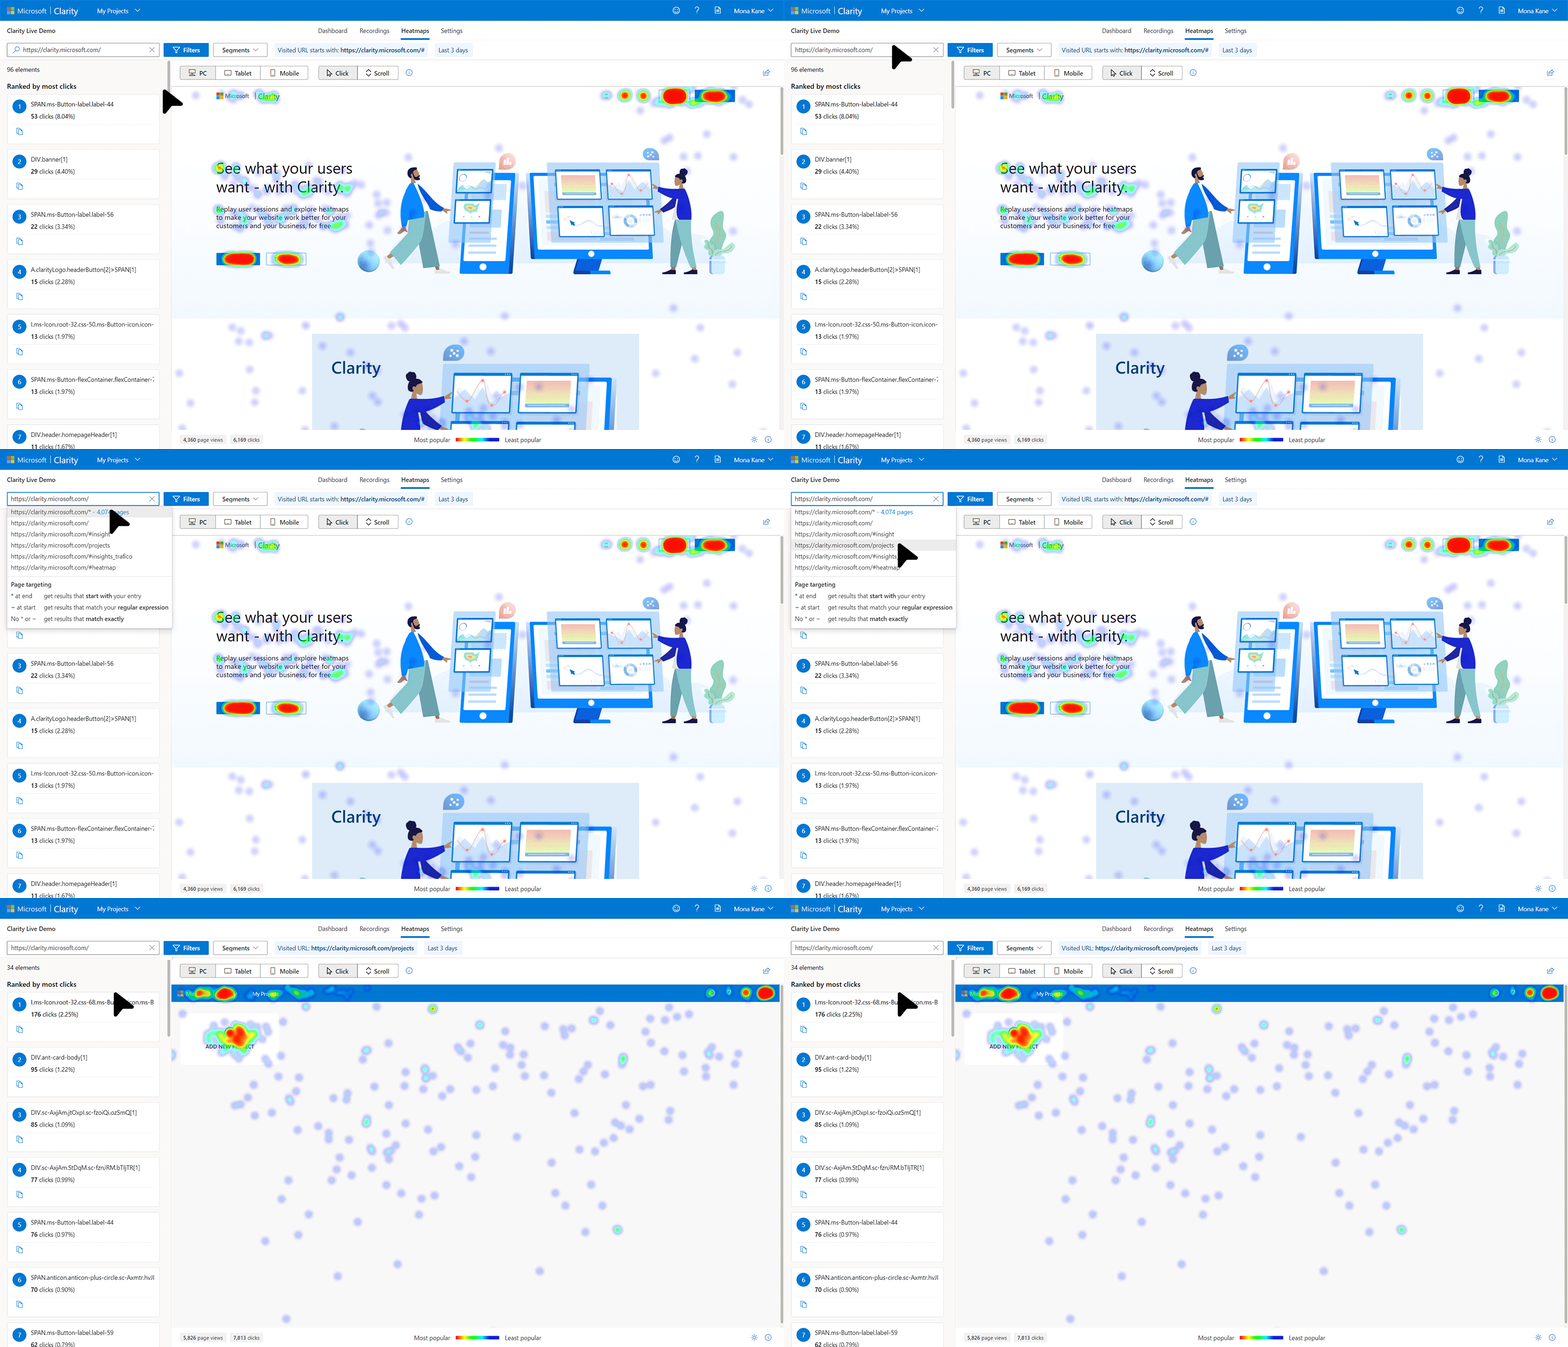
Apart from viewing click or scroll heatmaps for a page, Clarity lets you view a list of the most popular elements on the page or dig into each element for more detailed metrics. It also offers advanced filtering options that many competitors don't provide on their free plans. You can even analyze two heatmaps side by side, useful if you're running an A/B test and want to compare two versions of the same page.
Session replays
A session replay is a recording of a specific user's entire session on your site or app. To save time, Clarity includes a "Skip Inactivity" option that excludes stretches where the user shows no noticeable activity. Session replays let you follow a user's journey step by step and understand their behavior on a whole new level, catching small nuances you'd otherwise miss and experiencing your product through your customer's eyes.
Session replays help you discover issues such as confusing UX design, unclear call-to-action buttons, and interface bugs. Your analytics software can tell you that a given page has an issue (for example, an unusually high bounce rate), while session replays help you understand what’s really causing it.
Clarity keeps recordings for 30 days from the time they're captured, so review the sessions you care about within that window.
Behavioral metrics
Clarity tracks a number of so-called “semantic metrics” that are normally used to identify the cases when a user is frustrated with something on your site. Let’s take a closer look at some of these metrics.
Excessive scrolling
Clarity compares the amount of vertical scrolling within a given session to the expected average and can conclude that excessive scrolling has taken place. Excessive scrolling usually implies poor UX or irrelevant content and is a strong indicator of user frustration that often leads to leaving the site.
Rage clicks
Rage clicks is the case when a user clicks on the same area multiple times in a rapid manner. Most of the time, this indicates that the user expects a certain element to be interactive which turns out not to be the case.
Dead clicks
Dead clicks are similar to rage clicks in that users get a result which is different from what they were expecting. This is the case when the user clicks on an element but receives no response in a reasonable amount of time. Dead clicks usually imply poor UX, broken elements, or that it’s taking too long for the expected response to take place (potential site speed issues).
Quick backs
In this scenario, the user navigates to a different page but quickly comes back to the starting point. This could mean that something is wrong with the navigation or the description of the link.
Clarity's dashboard
While the features above give a detailed, page-by-page or session-by-session view, the dashboard provides a high-level picture of your site's traffic: aggregate metrics like average time on site, the total number of dead link clicks, and excessive scroll cases.

Clarity's advanced filtering and tagging system lets you drill into deviations and unusual behavior beyond this general overview, which you can then examine further through heatmaps and session replays.
Copilot insights
Clarity includes Copilot, which uses generative AI to summarize your data in plain language. It saves you from watching every recording yourself. Copilot covers three jobs:
- Session insights: a short summary of the key takeaways from a single recording
- Grouped session insights: one summary across many recordings, selected with Clarity's filters
- Copilot chat: ask a question about your dashboard and get a short answer back
Use Copilot to find which sessions deserve a closer look, then open those recordings to see the details yourself.
Softr integration
Now that you know what Clarity does and why it matters, you might be wondering how to add it to your website or app. Integrating Clarity anywhere usually means pasting a custom script from your Clarity project settings into your site's source code. For Softr users, it's simpler: open Settings, go to Integrations, select Microsoft Clarity, and paste your Clarity project ID. Softr handles the rest.
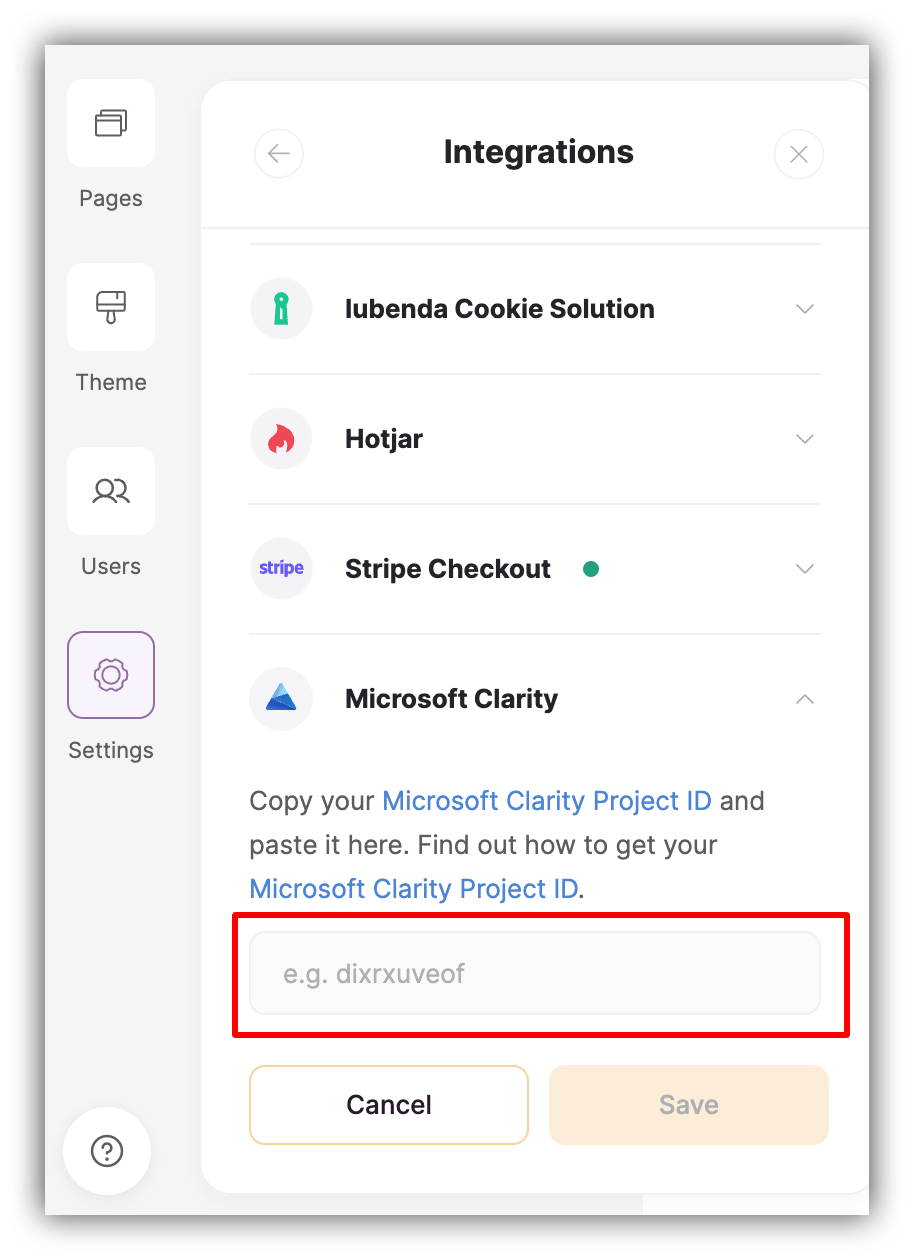
When you save the setting and publish your app, Clarity starts collecting data on every page of your app, including pages restricted to specific user groups. Data shows up in your Clarity dashboard within a few hours. Once traffic builds up, review heatmaps and session replays to see where visitors get stuck, whether that's a confusing form on a client portal or a dead-end button in an internal tool.
If your app has visitors in the EEA, the UK, or Switzerland, Clarity needs a consent signal for them. Without consent, Clarity splits each visit into separate sessions and limits recordings. Microsoft's consent documentation explains the options.
Check out our step-by-step guide on integrating Clarity with Softr if you need more detail.
Pairing Clarity with your own dashboards in Softr
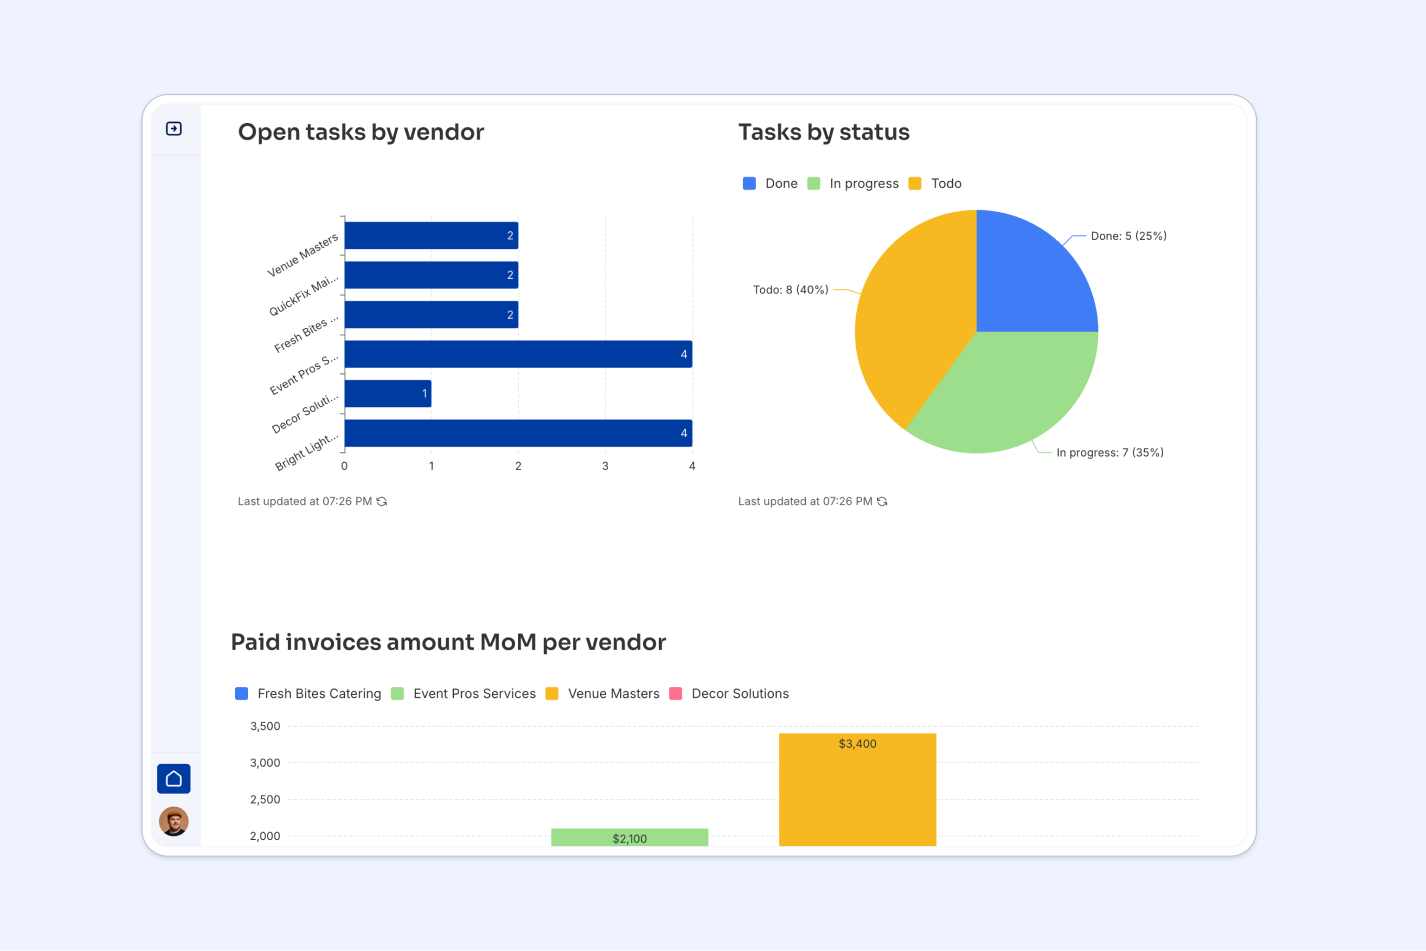
Clarity is great at showing you how people use your app, but it won't tell you what is happening inside your business data. That's where a custom dashboard, built directly on your Softr Databases or connected data source, comes in.
For example, if Clarity shows that users abandon a specific step in your client portal, you can build a dashboard tracking completion rates for that same step, then pair the qualitative "why" from Clarity with the quantitative "how many" from your app data. When a fix is ready, you can even trigger a Softr Workflow to notify your team or update records automatically once the underlying issue is resolved.
About Softr
Softr is an AI app builder for creating real business software without code. Describe what you need, and Softr's AI Co-Builder builds the database, interface, and workflows already connected and ready for real users, or you can start from a template or build manually for full control.
Teams use Softr to build client portals, internal tools, CRMs, and dashboards, backed by Softr Databases or 21+ external data sources like Airtable and Google Sheets. Granular user groups and permissions let you control exactly who sees and does what, whether you're tracking behavior with Clarity on a public marketing page or a fully gated internal app.
Sign up for free and start building.
Frequently asked questions
Is Microsoft Clarity really free to use?
How is Microsoft Clarity different from Google Analytics?
Does adding Microsoft Clarity to my Softr app affect performance or security?
Can I use Microsoft Clarity on a client portal or internal tool built with Softr?
Where do I find my Clarity project ID to connect it to Softr?