


Looking to streamline your reporting and make better decisions, faster? Dashboard tools help you turn messy spreadsheets and disconnected data into clean, visual insights your team can actually use. Whether you’re tracking performance, monitoring KPIs, or sharing updates with stakeholders, a good dashboard makes the information clear at a glance.
The best part? You don’t need to pay to get started. In this post, we’ll cover five free dashboard tools that make it easier to visualize your data and stay on top of what matters.
What is a dashboard tool?
A dashboard tool helps you turn raw data into a clear, visual layout your team can actually use. It pulls from one or more sources—like spreadsheets, databases, or project tools—and keeps everything in sync, so you don’t have to update slides or hunt down the latest version.
You might use a dashboard to track project timelines, flag overdue tasks, or monitor sales goals by region. Instead of jumping between tools, everything lives in one place, updated in real time.
Types of dashboard tools
Not all dashboard tools work the same way. Some focus on visualizing performance data, while others help you manage tasks, track deliverables, or share client updates. Here are the main types to know:
1. Internal dashboards
These are used inside your team to keep track of projects, KPIs, or day-to-day operations. They often pull data from task trackers or databases and help you spot blockers or delays early. They also usually have access control with only logged-in users being able to view internal information.
Example: An operations manager uses a dashboard to track job status across field teams in different regions.
2. Client-facing dashboards
Client-facing dashboards let you share filtered, relevant data with clients—without giving them access to your raw files or internal systems. They often include branding and custom permissions to tailor the experience.
Example: A marketing agency shares a live dashboard showing ad spend, clicks, and conversions for each client.
3. Data visualization tools
These are designed to help you analyze large amounts of structured data—like product usage or revenue trends. Most connect to databases or spreadsheets and offer powerful charting tools.
Example: A startup founder builds a real-time dashboard to track user signups, churn, and retention from their database.
4. Embedded dashboards
Embedded dashboards let you place dashboards inside another product, portal, or internal tool. They’re ideal when you want your data views to appear where your users already work.
Example: A SaaS company embeds custom usage dashboards into each customer’s account portal.
What to look for in free dashboard tools
Choosing the right dashboard tool isn’t just about pretty charts. For small teams, especially in client service or operations roles, it’s about visibility, ease of use, and control. Here’s a practical checklist to help you evaluate tools that actually fit your workflow:
- Real-time data updates: Pick tools that allow you to avoid manual reporting by real-time, two-way syncing directly with tools like Google Sheets, monday.com, Hubspot, Airtable, or Notion.
- Layout flexibility: Choose a tool that supports more than just charts—like lists, kanban, or status views.
- Access control: Make sure you can show the right data to the right people, especially for client work.
- Easy sharing or embedding: Look for secure ways to share dashboards via a link or inside a portal.
- Broad data support: The tool should connect to your current systems—and scale with you as needs grow
5 best free dashboard tools for 2025
If you’re looking for a simple way to organize and share live data—without relying on slide decks or spreadsheet screenshots—these free dashboard tools are a great place to start.
1. Softr
Best for building client-ready dashboards on live data, no code needed.

Softr stands out as a no-code platform for building flexible dashboards and other internal tools on top of your existing data. You can connect data sources like Airtable, Google Sheets, or Softr’s native database (beta), and control exactly what’s shown and who can see it. Whether you’re tracking KPIs, visualizing project progress, or sharing updates with clients, Softr lets you build a dashboard that fits your workflow.
Who is Softr for
Softr is a good fit if you need to share data with your team or clients. It works well for ops teams who want to pull live data from their data source and show the right metrics to the right people. You can track things like project status, team KPIs, or client deliverables—all in a clean, branded layout.
Key features
- Drag-and-drop layout: Build and update your dashboard visually, no code or developer needed.
- 14+ native data source integrations: Softr connects to Airtable, Google Sheets, HubSpot, Notion, monday.com, BigQuery, SQL databases, and more. You can also connect to almost any external data source via REST API—or use Softr’s own native database (currently in beta).
- Custom access control and permissions: Control who sees what. Show each client or team member only the data that applies to them.
- Branded design: Customize fonts, colors, and layout to match your brand or client presentation.
- Multi-block pages: Combine charts, lists, metric cards, and more—all on one screen.
- PWA: Dashboards are responsive and easy to access on any device.
- Expand into other tools: Build dashboards into client portals, intranets, or other internal tools or portals built with Softr.
Softr pros
- Fast to build: You can launch a dashboard in minutes without dev help, or start from a template.
- Connects to live data: Softr integrates with 14+ data sources with 2-way, real-time sync, so you don’t need to import or sync manually.
- User permissions: Show different views to different users—great for client portals or internal teams.
- One tool, multiple use cases: Softr isn’t just for dashboards. You can build internal tools, client portals, reports, and even lightweight CRMs—all on the same platform
Softr cons
- Not built for heavy analyticsc: Softr works best for operational dashboards, not deep data analysis or BI use cases.
- Limited visualization options: You won’t get complex charts or visualizations like you would with tools like Looker or Power BI.
Softr pricing
Softr offers flexible pricing plans, so you can build a knowledge base at any tier:
- Free for up to 10 users per month
- Paid plans start at $49/month for 20 users (when billed annually)
- Professional: Starts at $139/month for 100 users (when billed annually)
- Business: Starting at $269/month for 2500 users (when billed annually)
- Custom plans for enterprise customers
2. Google Looker Studio
Best for free dashboards with native Google integrations

Google Looker Studio (formerly Google Data Studio) is a free, web-based dashboard and reporting tool that enables users to create interactive visualizations from various data sources. It offers a user-friendly interface with drag-and-drop functionality, making it accessible for users without technical expertise.
It’s ieal for small to medium-sized businesses, marketing teams, and agencies that rely heavily on Google services. It's particularly useful for creating reports that combine data from platforms like Google Analytics, Google Ads, and Google Sheets.
Key features:
- Native Google integrations: Connect directly to Google Sheets, Analytics, Ads, and BigQuery for live reporting
- Drag-and-drop editor: Build charts, tables, and dashboards without writing any code
- Pre-built templates: Quickly launch common dashboards for marketing, SEO, and sales reporting
- Interactive filters and controls: Let viewers drill into date ranges, campaigns, or segments
- Link-based sharing: Share dashboards securely via link or embed in websites
- Real-time sync: Dashboards update automatically when your source data changes
Looker Studio pros:
- Free to use with robust features
- User-friendly interface suitable for non-technical users
- Strong integration with Google ecosystem
- Real-time data visualization
Looker Studio cons:
- Limited advanced analytics capabilities compared to some BI tools
- Customization options may be insufficient for complex reporting needs
- Performance can be affected by large datasets
Pricing overview:
- Looker Studio (Free): Provides access to core features, including data connectors, report creation, and sharing capabilities.
- Looker Studio Pro: Offers enhanced features such as team collaboration tools, administrative controls, and support services. Pricing starts at $9 per user per project per month.
3. Metabase
Best for self-hosted dashboards with SQL and no-code flexibility

Metabase is an open-source business intelligence tool that allows teams to explore and visualize data without extensive technical knowledge. It connects directly to various databases, enabling users to create dashboards and reports through a user-friendly interface or by writing SQL queries.
It’s great for small to medium-sized businesses and teams that require a cost-effective, self-hosted solution for data analysis. It's particularly useful for organizations that have technical resources to manage the setup and maintenance of the tool.
Key features:
- No-code query builder: Create reports using dropdowns and filters—no SQL needed
- SQL editor for analysts: Run complex queries directly when you need full control
- Custom dashboards: Combine visualizations (charts, tables, KPIs) to track key metrics
- Scheduled reports: Email dashboards or specific questions on a set schedule
- Basic access control: Set permissions for viewing or editing dashboards
- Self-hosting option: Deploy on your own servers for full data control and compliance
Metabase pros:
- Free and open-source with a supportive community
- User-friendly interface suitable for non-technical users
- Flexible deployment options (self-hosted or cloud)
- Regular updates and active development
Metabase cons:
- Requires technical expertise for setup and maintenance
- Limited advanced features in the free version
- Performance may vary depending on infrastructure
- Customization options may be limited compared to other tools
Pricing overview:
- Open Source (Free): Self-hosted version with core features suitable for small teams.
- Starter Plan: Cloud-hosted solution starting at $85/month, including five users, with additional users at $5/month each.
- Pro Plan: Enhanced features for larger teams at $500/month, including ten users, with additional users at $10/month each.
- Enterprise Plan: Custom pricing for organizations requiring advanced features and support.
4. Trevor.io
Best for no-code dashboards with SQL flexibility

Trevor.io is a self-service analytics platform that enables teams to build dashboards and run queries without needing SQL expertise. It connects directly to your database, allowing users to explore data through an intuitive query builder or by writing SQL. Dashboards can be created and shared internally or embedded into applications for external stakeholders.
It’s suitable for small to medium-sized businesses, especially SaaS companies and marketplaces, that require a flexible, user-friendly tool for data analysis. It's particularly useful for teams that want to empower non-technical members to access and interpret data without relying on engineers.
Key features:
- Visual query builder: Lets non-technical users explore data by dragging fields and setting filters without writing SQL
- Optional SQL editor: For analysts and engineers who need full control and custom logic
- Live dashboards: Show up-to-date metrics directly from your database, no need for exports
- Embeddable views: Share dashboards inside other tools or portals, with optional user filters
- Scheduled reports and alerts: Automatically email insights to teams or flag anomalies
- Role-based access: Control who can see or change what, down to the query level
Trevor.io pros:
- Quick setup with no coding required
- Empowers non-technical users to access data
- Flexible sharing options, including embedding and exports
- Responsive customer support
Trevor.io cons:
- Limited advanced visualization options compared to some BI tools
- May not support complex data modeling needs
- Free tier has usage limitations
Pricing overview:
- Free tier: Includes core features with usage-based credits
- Pro plan: Starts at $75/month for 3,000 credits, suitable for small teams
- Plus plan: From $500/month, includes unlimited users, single sign-on, audit logs, and self-hosting options
5. Appsmith
Best for developer-led teams building custom internal tools
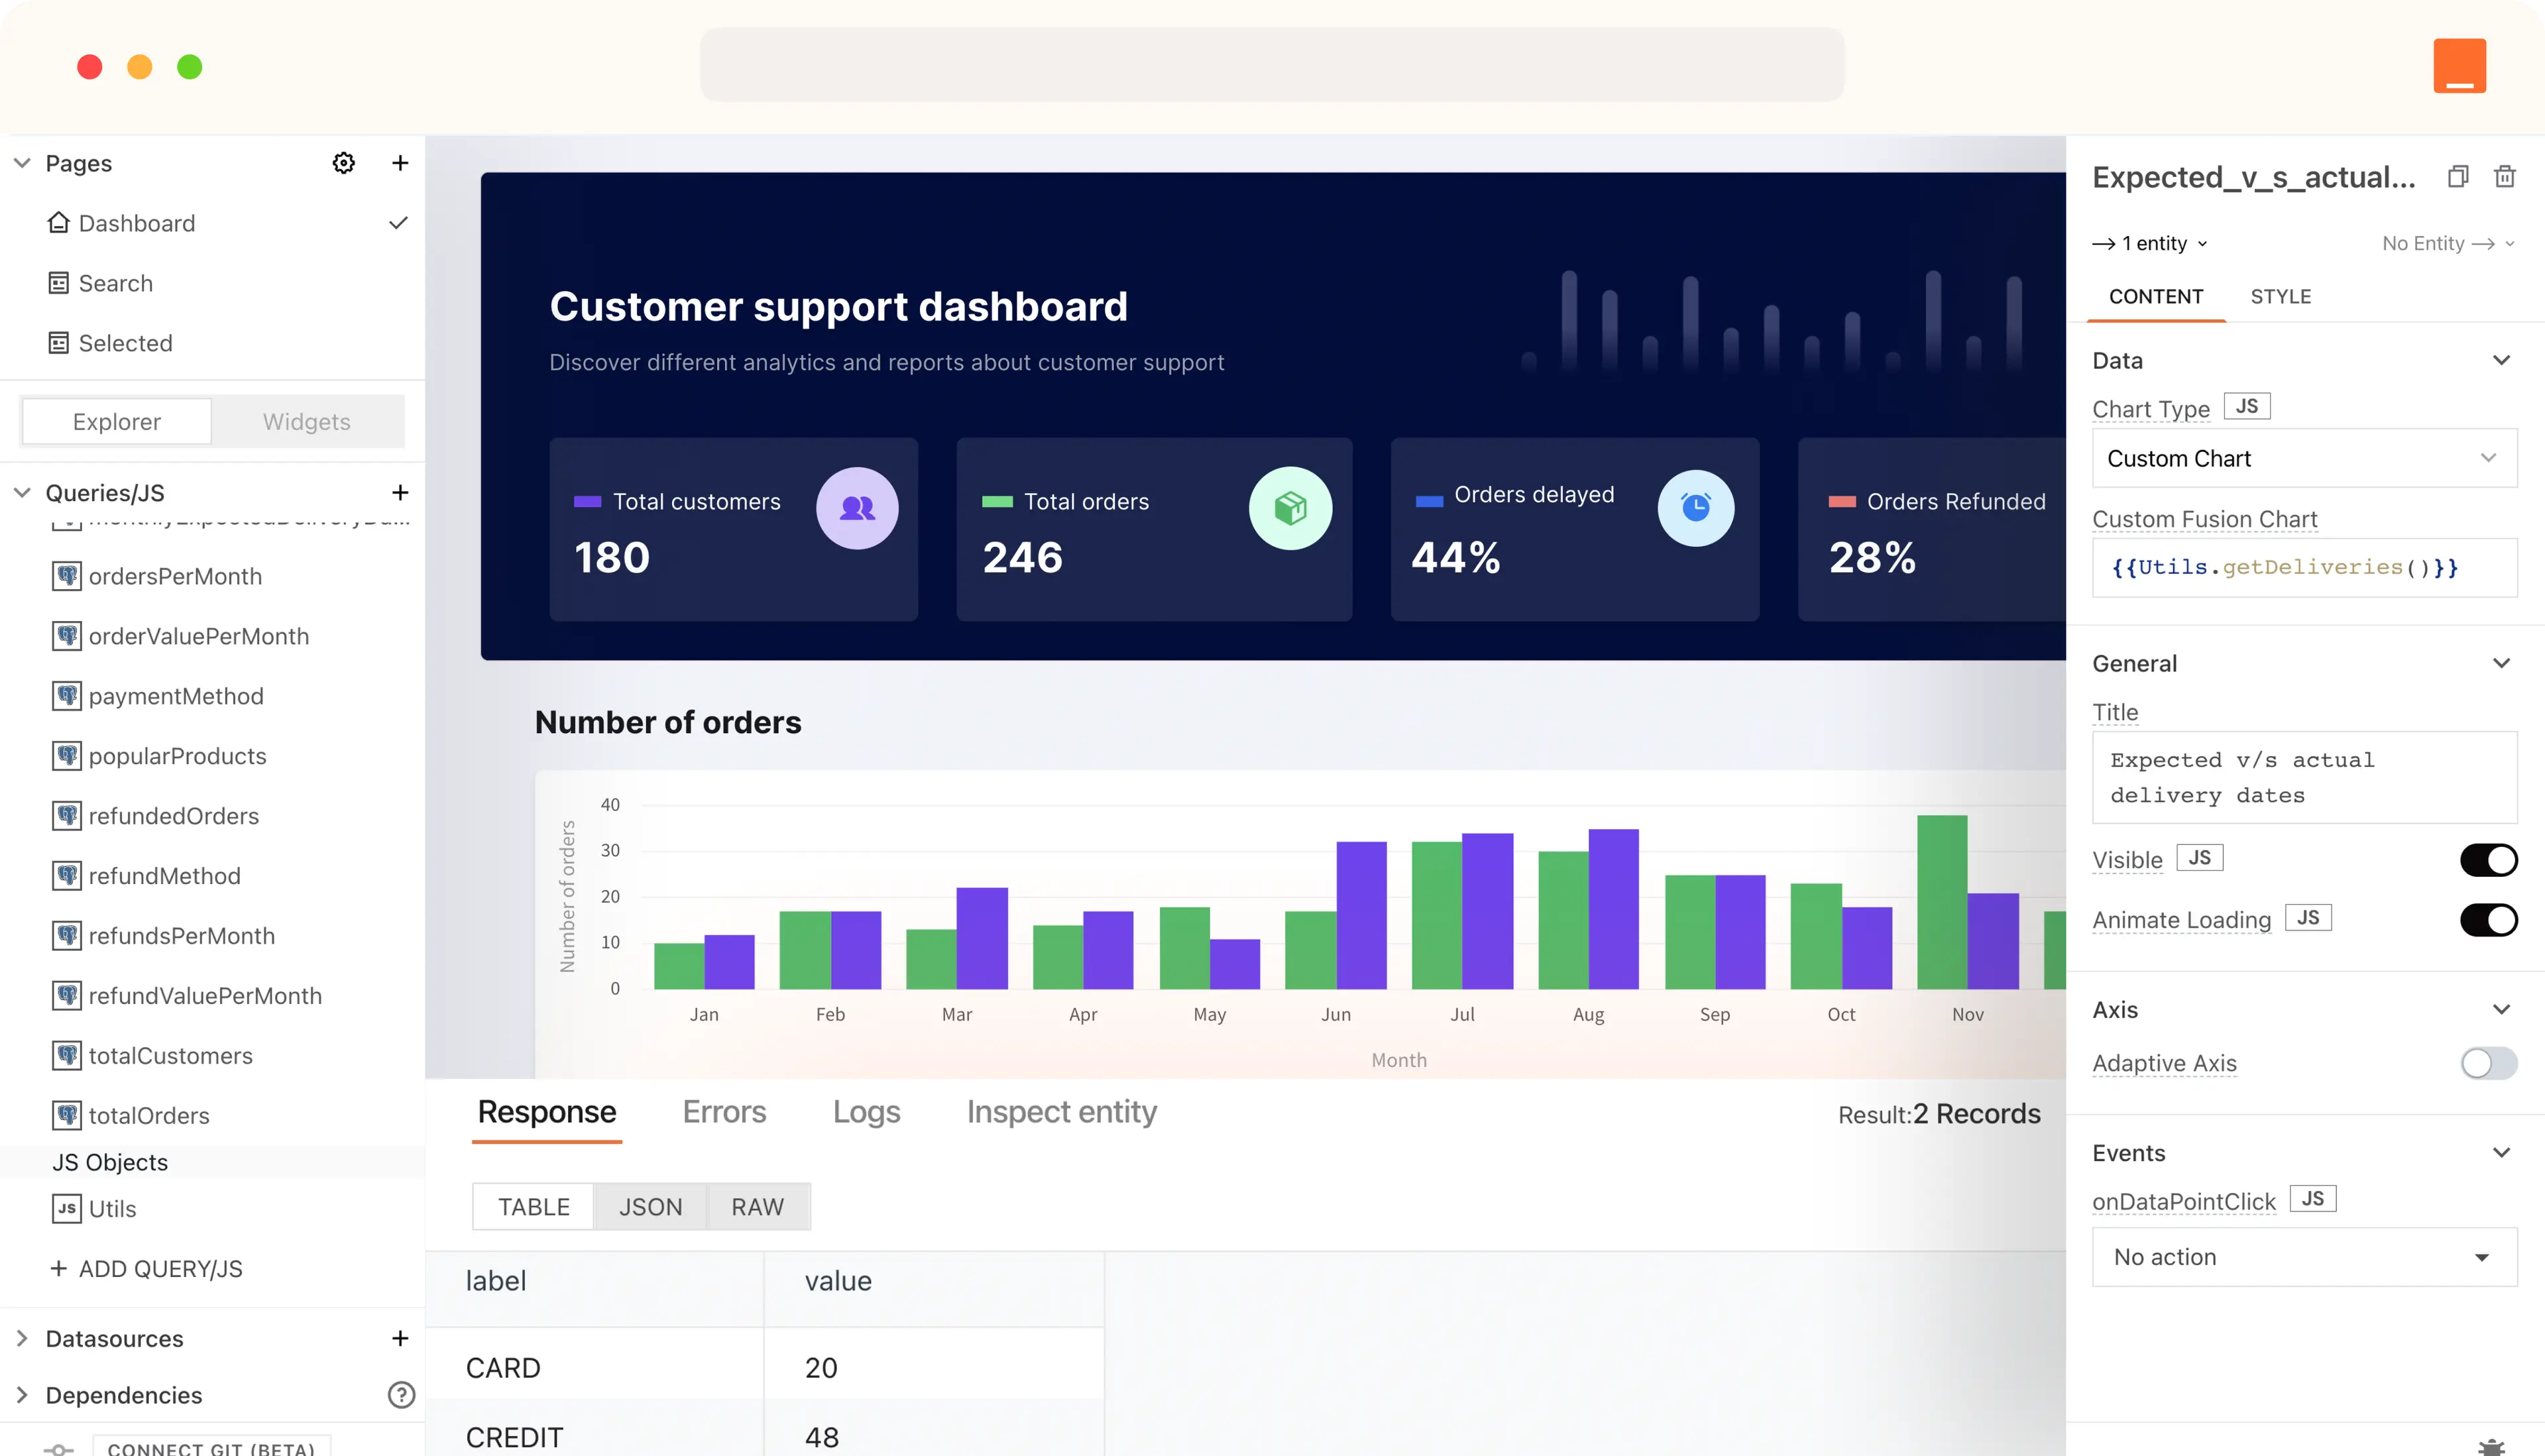
Appsmith is an open-source, low-code platform that enables developers to build custom internal tools, dashboards, and admin panels. It offers a drag-and-drop interface with a library of pre-built widgets, allowing users to connect to various data sources and APIs. Developers can write JavaScript to add custom logic, making it a flexible solution for building complex applications.
Key features:
- Drag-and-drop UI builder: Quickly assemble interfaces using a library of 45+ pre-built widgets, including tables, charts, and forms.
- JavaScript support: Write custom logic and manipulate data directly within the platform using JavaScript.
- Data source integrations: Connect to various databases (e.g., PostgreSQL, MongoDB) and APIs (REST, GraphQL) to fetch and manipulate data.
- Role-based access control (RBAC): Define user roles and permissions to control access to different parts of the application.
- Git integration: Manage application versions and collaborate with team members using Git repositories.
- Self-hosting and cloud options: Deploy applications on your own infrastructure or use Appsmith's cloud hosting services.
Appsmith pros:
- Highly customizable with support for custom code and integrations.
- Open-source with an active community and regular updates.
- Flexible deployment options, including self-hosting.
- Comprehensive access control features for enterprise security needs.
Appsmith cons:
- Requires technical expertise to fully leverage its capabilities.
- May have a steeper learning curve for non-developers.
- Some advanced features are only available in paid plans.
Pricing overview:
- Free Plan: $0/month, includes core features, up to 5 users, and community support.
- Business Plan: $15/user/month, adds features like unlimited users, custom roles, audit logs, and email/chat support.
- Enterprise Plan: $2,500/month for 100 users, offers advanced security features, dedicated support, and managed hosting options.
Start simple, scale when needed
If your team is still sharing data through spreadsheets, screenshots, or cluttered slides, the right dashboard tool can make a big difference. You don’t need a complex BI platform to get there—you just need a solution that’s flexible, easy to manage, and built for how your team works.
The key is to pick something that works with your data, fits your workflow, and doesn’t require a developer to maintain. Start simple, and choose a tool that can grow with you as your needs evolve.
Want a faster way to get started? Softr has pre-built templates so you can launch your first live dashboard in minutes.
What is Softr
Softr is the easiest way to turn your data into powerful business apps—no code required. Connect to your spreadsheet or database, customize layout and logic, and share with your team or clients.
Join 700,000+ users worldwide, building client portals, internal tools, CRMs, dashboards, project management systems, inventory management apps, and more—all without code.
Join 700,000+ users worldwide, building client portals, internal tools, CRMs, dashboards, project management systems, inventory management apps, and more—all without code.
Get started free

Harshala Chavan


Categories


